
《3D图像编辑软件》(Kylebank Graphis v2.9.33)[压缩包]
电驴资源
| 用户共享的电驴资源列表 | |
|---|---|
| Kylebank.Graphis.v2.9.33-BEAN.zip | 30.33 MB |
| 30.33 MB | |
电驴资源简介
中文名: 3D图像编辑软件英文名: Kylebank Graphis v2.9.33资源格式: 压缩包发行时间: 2009年地区: 美国语言: 英文简介:

官方网站 http://www.kylebank.com/
使用下载 http://www.kylebank.com/Downloads/Graphis2933Setup.exe
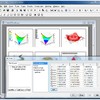
Graphis是一个3D图像编辑软体, 它最大的功能是可以把每个项目以表格形式平铺显示,每个项目都有一个曲线图表的预览图。还能对图像进行图表分析来绘制它的数学表达式。
引用Graphis graphing software is a powerful scientific/engineering data visualization and analysis tool. At the core of its functionality is the ability to create both tabular and analytical curves. Tabular curves can be used to plot data held in tabular form, while analytical curves can be used to plot mathematical expressions.
Tabular curves are created in Graphis by entering data manually into a curve's table, by pasting it from another application such as Excel, or by importing it from data previously imported into a Graphis Spreadsheet. Graphis spreadsheets allow data to be imported from character-delimited text files using an Excel-like data import feature.
Graphis 2D and 3D visualization software makes the generation of analytical curves effortless. For example, to plot sin(x), simply enter y = sin(x) in the curve definition window. The curve definition need not be a single line. It can consist of multiple lines consisting of constants, variables and expressions defining components of an overall formula.
In addition to 2D (1 independent variable) data plotting, Graphis provides a sophisticated set of 3D (2 independent variables) plot types which can also be used individually or combined to construct a wide range of graphs. These can range from standard surface plotting to complex 3D visualizations comprising analytical expressions, tabular data, 3D objects, annotation, and image overlay.
Data analysis capabilities are also provided in the form of statistical functions and standard statistical analysis plots such as histograms, box plots, probability plots and curve fitting. The program also features a general multidimensional nonlinear regression tool.
Graphis 2D and 3D plotting software can also be driven remotely from another program via COM automation. Controlling Graphis from a programming language provides a wide range of possibilities, from writing code which interactively controls Graphis via your own dialogs, to creating movies utilising any combination of Graphis features you wish. Click here to download some example movies.
Built around this core functionality is an extensive range of features to allow you to create presentation-quality graphs with the minimum of effort. See here for an overview of how Graphis data visualization software is used, and here for a more detailed list of features available in Graphis.
nfo:
代码 Graphis v2.9.33 c Kylebank
² ִִִִִִִִִִִִִִִִִִִִִִִִִִִִִִִִִִִִִִִִִִִִִִִִִִִִִִִִִִִִִִִִִִִִִִִִִִִ ²
± Disks 7 x 5,00mb Date March 20, 2009 ±
° OS Windows °
² Release Description
± ~~~~~~~~~~~~~~~~~~~
Graphis graphing software is a powerful scientific/engineering data
visualization and analysis tool. At the core of its functionality is the
ability to create both tabular and analytical curves. Tabular curves can
be used to plot data held in tabular form, while analytical curves can be
used to plot mathematical expressions.
Tabular curves are created in Graphis by entering data manually into a
curve's table, by pasting it from another application such as Excel, or by
importing it from data previously imported into a Graphis Spreadsheet.
Graphis spreadsheets allow data to be imported from character-delimited
text files using an Excel-like data import feature.
°
Installation
²
± Just unpack install. Use included keygen to make valid serial.
下载链接来自sharevirus
未经过安装测试与安全检测,使用者后果自负与本论坛无关
软体版权归原作者及其公司所有,如果你喜欢,请购买正版
官方网站 http://www.kylebank.com/
使用下载 http://www.kylebank.com/Downloads/Graphis2933Setup.exe
Graphis是一个3D图像编辑软体, 它最大的功能是可以把每个项目以表格形式平铺显示,每个项目都有一个曲线图表的预览图。还能对图像进行图表分析来绘制它的数学表达式。
引用Graphis graphing software is a powerful scientific/engineering data visualization and analysis tool. At the core of its functionality is the ability to create both tabular and analytical curves. Tabular curves can be used to plot data held in tabular form, while analytical curves can be used to plot mathematical expressions.
Tabular curves are created in Graphis by entering data manually into a curve's table, by pasting it from another application such as Excel, or by importing it from data previously imported into a Graphis Spreadsheet. Graphis spreadsheets allow data to be imported from character-delimited text files using an Excel-like data import feature.
Graphis 2D and 3D visualization software makes the generation of analytical curves effortless. For example, to plot sin(x), simply enter y = sin(x) in the curve definition window. The curve definition need not be a single line. It can consist of multiple lines consisting of constants, variables and expressions defining components of an overall formula.
In addition to 2D (1 independent variable) data plotting, Graphis provides a sophisticated set of 3D (2 independent variables) plot types which can also be used individually or combined to construct a wide range of graphs. These can range from standard surface plotting to complex 3D visualizations comprising analytical expressions, tabular data, 3D objects, annotation, and image overlay.
Data analysis capabilities are also provided in the form of statistical functions and standard statistical analysis plots such as histograms, box plots, probability plots and curve fitting. The program also features a general multidimensional nonlinear regression tool.
Graphis 2D and 3D plotting software can also be driven remotely from another program via COM automation. Controlling Graphis from a programming language provides a wide range of possibilities, from writing code which interactively controls Graphis via your own dialogs, to creating movies utilising any combination of Graphis features you wish. Click here to download some example movies.
Built around this core functionality is an extensive range of features to allow you to create presentation-quality graphs with the minimum of effort. See here for an overview of how Graphis data visualization software is used, and here for a more detailed list of features available in Graphis.
nfo:
代码 Graphis v2.9.33 c Kylebank
² ִִִִִִִִִִִִִִִִִִִִִִִִִִִִִִִִִִִִִִִִִִִִִִִִִִִִִִִִִִִִִִִִִִִִִִִִִִִ ²
± Disks 7 x 5,00mb Date March 20, 2009 ±
° OS Windows °
² Release Description
± ~~~~~~~~~~~~~~~~~~~
Graphis graphing software is a powerful scientific/engineering data
visualization and analysis tool. At the core of its functionality is the
ability to create both tabular and analytical curves. Tabular curves can
be used to plot data held in tabular form, while analytical curves can be
used to plot mathematical expressions.
Tabular curves are created in Graphis by entering data manually into a
curve's table, by pasting it from another application such as Excel, or by
importing it from data previously imported into a Graphis Spreadsheet.
Graphis spreadsheets allow data to be imported from character-delimited
text files using an Excel-like data import feature.
°
Installation
²
± Just unpack install. Use included keygen to make valid serial.
下载链接来自sharevirus
未经过安装测试与安全检测,使用者后果自负与本论坛无关
软体版权归原作者及其公司所有,如果你喜欢,请购买正版